Tag Archives: Real estate

Twin Cities Housing Market update. Week Ending Oct 08, 2011


Another great weekly housing market update from Minneapolis Area Association of Realtors.

We continue to grind away at a faster pace on our inventory.  This week’s year-over-year stats:

Change in New Listings:      -13%  

Change in Pending Sales:   +48.3%

Change in Inventory:            -21.0%

We are now down to 22,434 listings on the market.

View Full Weekly Market Update Report


Leave a comment

Filed under Uncategorized

Farmland Is Pricey. The Fed Is Worried – Businessweek


Farmland Is Pricey. The Fed Is Worried – Businessweek.

Amazing what pricing does with subsidies behind it.  Wonder what kind of chaos this will cause in the financial markets, food supply, and the family farmer when this bubble bursts…

5 Comments

Filed under Uncategorized

NAHB: October 2011 Improving Market Index


The National Association of Home Builders released their Improving Market Index.  This index was started a couple of months ago by NAHB and First American.  This index hasn’t hit upon the Twin Cities area yet, primarily because we are not an improving market yet…  I do want to keep an eye on this because eventually we will be showing up on this index, hopefully.

Here is a pretty good video explaining the latest index results from NAHB.  NAHB: October 2011 Improving Market Index.

Basically, the improving markets are in Energy Producing areas (a.k.a. oil drilling).  So this is further evidence our biggest struggle is jobs, not inventory.


click to enlarge


October 6, 2011 – The second edition of the National Association of Home Builders/ First American Improving Markets Index (IMI), released today, shows 23 individual housing markets now qualifying as “improving” under the new gauge’s parameters. This is nearly double the 12 housing markets that made the list last month.

The index reveals metropolitan areas that have shown improvement for at least six months in housing permits, employment and housing prices. The following metros were listed in October:

  • Alexandria, LA
  • Amarillo, TX
  • Anchorage, AK
  • Bismarck, ND
  • Casper, WY
  • Fairbanks, AK
  • Fayetteville, NC
  • Houma, LA
  • Iowa City, IA
  • Jonesboro, AR
  • Kankakee, IL
  • McAllen, TX
  • Midland, TX
  • New Orleans, LA
  • Odessa, TX
  • Pine Bluff, AR
  • Pittsburgh, PA
  • Sherman, TX
  • Sumter, SC
  • Waco, TX
  • Waterloo, IA
  • Wichita Falls, TX
  • Winston-Salem, NC

“Both the number and geographic diversity of improving housing markets expanded this month, with Iowa, Illinois and South Carolina all newly represented by one entry or more on the list,” said National Association of Home Builders (NAHB) Chairman Bob Nielsen, a home builder from Reno, Nev. “This is further evidence that, despite the tough conditions that persist in many cities, pockets of improvement are emerging in local housing markets across the country.”


1 Comment

Filed under Uncategorized

Weekly Twin Cities Real Estate Market Update. Week Ending Oct 1, 2011


Still heading the right direction!  The 30 year fixed rate mortgage dipped below 4% for the first time ever last week which should hopefully improve the market conditions.

For the Week Ending October 1st we saw a continued weaning of inventory with fewer year over year new listings and increased Pending sales.

New Listings  decreased 21.0% to 1,219

Pending Sales increased to 32.7% to 926

Inventory decreased 22.8% to 23,177

The inventory will continue to come down in it’s seasonal pattern, but year over year we are still down.  If you look at the chart below you can see that we are in the range of the 2005 inventory levels.

I am going to stick my neck out on this one and “Call it”.  We have just entered “Balanced Market” territory.  We have now dipped below 7 month supply which puts us on the upper edge of a Balanced Market.   As far as staying in this territory is whole other matter…

In a Balanced Market we should see sale prices holding closer to the asking prices giving us some price stability.  To see prices increase we are going to need demand to kick up a few notches to bring us into the Seller’s Market of 1-4 month supply.  But after the last few years, this is great news.

View Full Report from Minneapolis Area Association of Realtors


Leave a comment

Filed under Uncategorized

Twin Cities Metro Area’s Pent Up Demand, Census Demographics projecting future housing demand.


After reading the National Association of Realtor’s article about the 15 to 19 age bracket and their housing needs, in my previous post.  It got me to think about our Region’s demographics and I was curious about some “ballpark” estimates on future housing demand in the Twin Cities area.

What kind of numbers are we talking about for the 15 to 19 age group and the 20 to 24 age group?  Here is the 2010 Census Chart on Age/Sex of the 7 County Twin Cities Region.

The 20 to 24 and the 25 to 29 age groups have been hit really hard by unemployment and have largely been left out of the housing market.  Let’s run some assumptions based on the 15 to 19 and 20 to 24 age groups.

Here are the numbers broken down for the age groups.


The 15 to 19 age group consists of 193,289 people in the 2010 Census for the Twin Cities Metro area.  We can’t assume that all of them will need housing; some will relocate out of State, some will get married, some will choose renting over owning and some will stay home with Mom and Dad.  So I am going to run with 50% of them will need housing,  it is just an arbitrary percentage I pulled out of thin air – maybe it is too high or too low but it is a nice round number.   So 50% of 193,280 of the 15 to 19 age group would be 96,644 housing units.  This will be over a period of let’s say 10 years for easy math and enough time for those age groups to enter the housing market, they would need  9,664 housing units per year.

If we look at the 20 to 24 age groups at 190,135 people, using the same 50% ratio we come up with 95,067.  Over the next 10 years would be 9,506 housing unit per year.

Looking at the 25 to 29 age group gets a little trickier to guess the numbers.  This is the age group that should begin to enter the housing market but with the economy many in this age group have been stuck.  If we were to run the same ratios we would come up with 110,383 housing units and over 10 years would be 11,038 per year.  I don’t really like those ratios on this age group, because some have entered the housing market by taking advantage of the First Time Homebuyer Tax Credit.  So for these purposes I am going to leave them out of this projection even though there is a fairly large number here that will enter the housing market.

So just looking at people age 15 to 24 we have a grand total of 191,712 housing units or 19,171 housing units a year.  Considering we have approx 24,000 housing units for sale, this could put a lot of pressure on the supply / demand ratio.   Remember, we have already accounted for the marriages and moving out the region in these figures. We haven’t taken into account the deaths and migration in this ballpark estimate, so it is not a figure I would use to do any serious forecasting with.

This estimate does however show us the “Pent Up Demand” that needs to be un-lodged , the only way to un-lodge this pent-up demand is to get these age groups Jobs.

Leave a comment

Filed under Uncategorized

High School Years and Future Housing Demand – More on the Pent up Demand


High School Years and Future Housing Demand.

This is an interesting article from the National Association of Realtors showing the future demand for housing.  They looked at the 15 to 19 year olds and the demand for housing they will require as they move out of Mom and Dads house.

NAR is speculating there will be greater demand going forward for rentals (apartments, multifamily) to meet this age groups needs for housing.  I partially agree with their conclusion with a couple of exceptions:

The early 2000’s generation moved directly into homeownership bypassing the rental phase for the most part so not a lot of rental properties were constructed.  The other main reason, and more importantly why additional rental properties weren’t built is because of costs.

During the 1960’s and 1970’s apartment buildings could be constructed at relatively low costs.  If you go through some of these older apartment buildings you will notice a couple of things right away, the wood frame construction and the lack of wheelchair access.  You will also notice all the cooking smells, this gets into the HVAC system differences.  Many of these buildings were built with 2×4 construction and either “garden style” (similar to split entry in single family), and lacking elevators.

If you look around and think about any “newer” apartment buildings, what do they have in common?  1) they are in high rent areas and 2) they are very large  3) they “amenities” such as pools and fitness rooms.   These new rental units need to be in locations that can demand a lot of rent in order to make the economics work for the construction costs. There also needs to be a lot of units to make the economics work for adding elevators and other building code requirements that weren’t around 30+ years ago.   Unless the economic formula changes or building codes change,  I don’t foresee builders supplying the need for additional apartments for this demographic in the marketplace.  The days of building a 4 unit to 30 unit building are gone.   This will put additional demand on rental housing, duplexes, four-plexes and single family homes.

I could be wrong, there is a lot of apartment units going up around the Twin Cities now – in high rent areas.  The market may be overbuilding apartment units which could force rents lower to pull in this demographic.  But as they are targeted now, the rents are too high for this demographic group just starting out.


Leave a comment

Filed under Uncategorized

The Tax Assessor-Should You Let Them In Your Home


It is Property Tax season, the Assessors have been making their rounds valuing the properties and your 2nd Half property taxes are due Friday…

Every year property taxes keep increasing while our values keep dropping.  This coming year most of the Cities property taxes are going up, the State reworked the Homestead Tax Credit to the Homestead Exclusion and to top that off there is talk of many school districts wanting an increase also.  We all feel like victims to this cycle and that there is nothing we can do.  Michael Bolton, a local appraiser has a great post about the process of valuations and the procedures for appealing your property taxes.

Take a few minutes to read his post and ask specific questions about your situation.

The Tax Assessor-Should You Let Them In Your Home


Leave a comment

Filed under Uncategorized

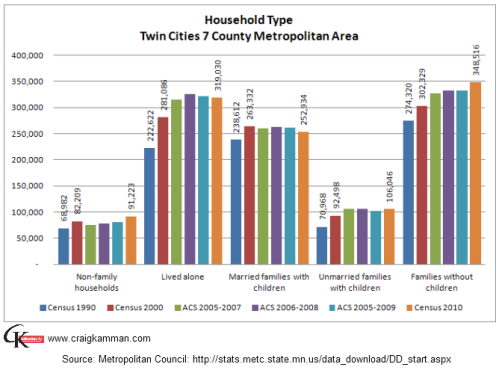
Twin Cities Metro Area Household Types, Homeowneship Rate, and Household Size


Last week I was in a conversation with a local builder about what kind of housing will be needed going forward.  Many factors influence the type of housing that needs to be added to a marketplace, including Household size, household types, income,  and jobs.

I have begun digging into some general questions, starting out on our Regional area then moving them into the specific location we intend to add housing units in.

This is general enough information to share about our region.  This data is available at the Metropolitan Council, which is pulled from the US Census and ACS reports.

The Twin Cities Household Size seems to have come back up to 2.5 in the latest 2010 Census.  (notice how accurate the information is, 2009 has 2 sets of information from the ACS – which don’t match up but are in the ballpark of each other.)

Since this information was available I was curious to see the Homeownership Rate for the Twin Cities 7 County Metro Area.  I wanted to see how the housing market bubble impacted our regional homeownership, it will also show us if more rental units are needed or owner occupied units needed.

The following is a pretty important factor to consider when adding product to the marketplace.  The Household Type.  There has been a lot of talk about the households changing dramatically, that there will no longer be need for the large homes because nobody is having kids anymore.  Judging by these stats, there is some truth to that – but not as dramatic as those statements claim to be.  We are seeing fewer children in the household makeups, but I would suspect when we get through this recession/recovery we will see that bounce right back up.  I suspect many younger couples are waiting to gain employment before starting a family… (hence our “pent-up demand”).

A view showing percentage of 2000 Census vs the 2010 Census.

1 Comment

Filed under Uncategorized

Fox News interviews my boss, Ron Peltier, Chairman and CEO of HomeServices of America


Ron Peltier is Chairman and CEO of HomeServices of America was interviewed on Fox News. ( HomeServices of America spun out of Edina Realty and owns many real estate companies including Edina Realty around the country.)

Apparently Ron follows my blog closely.  He did however touch on the subject of lending standards which I want to get into at some point here on my blog.

Click on watch interview


Leave a comment

Filed under Uncategorized

Commercial Real Estate Market set to rebound.


Maybe I should have finished that Headline off with a question mark.  There is a great post from HousingWire reporting on the SF Fed’s report suggesting the Cap Rates are indicating a turn around in the commercial real estate market.   I agree the cap rates are the key factor on investing in commercial property, however I don’t believe the economy is sound enough yet.  In order to achieve these rates of returns you need tenants (businesses) to occupy the space and pay the rent.  You also need a stable tax environment where property taxes aren’t skyrocketing underneath you undermining your rate of return.

Investors are expecting a widespread rebound in U.S. commercial real estate markets, according to an analysis published Monday by the San Francisco Federal Reserve Bank.

With the two most widely followed measures of commercial real estate prices showing divergent trends since early 2010, economists at the San Francisco Fed turned to capitalization rates as an indicator of expected returns on commercial properties.

“Recent declines in these cap rates appear to be signaling a commercial real estate rebound, indicating improved investor expectations of price growth in the market,” said the San Francisco Fed’s economic letter.

…..Price appreciation in Kansas City, Minneapolis, Salt Lake City and Austin, Texas, is expected to be about 2% higher than national trends would indicate, said Hobijn and Krainer.

Read Full Article to get their Graphs and details of the report.

2 Comments

Filed under Uncategorized